
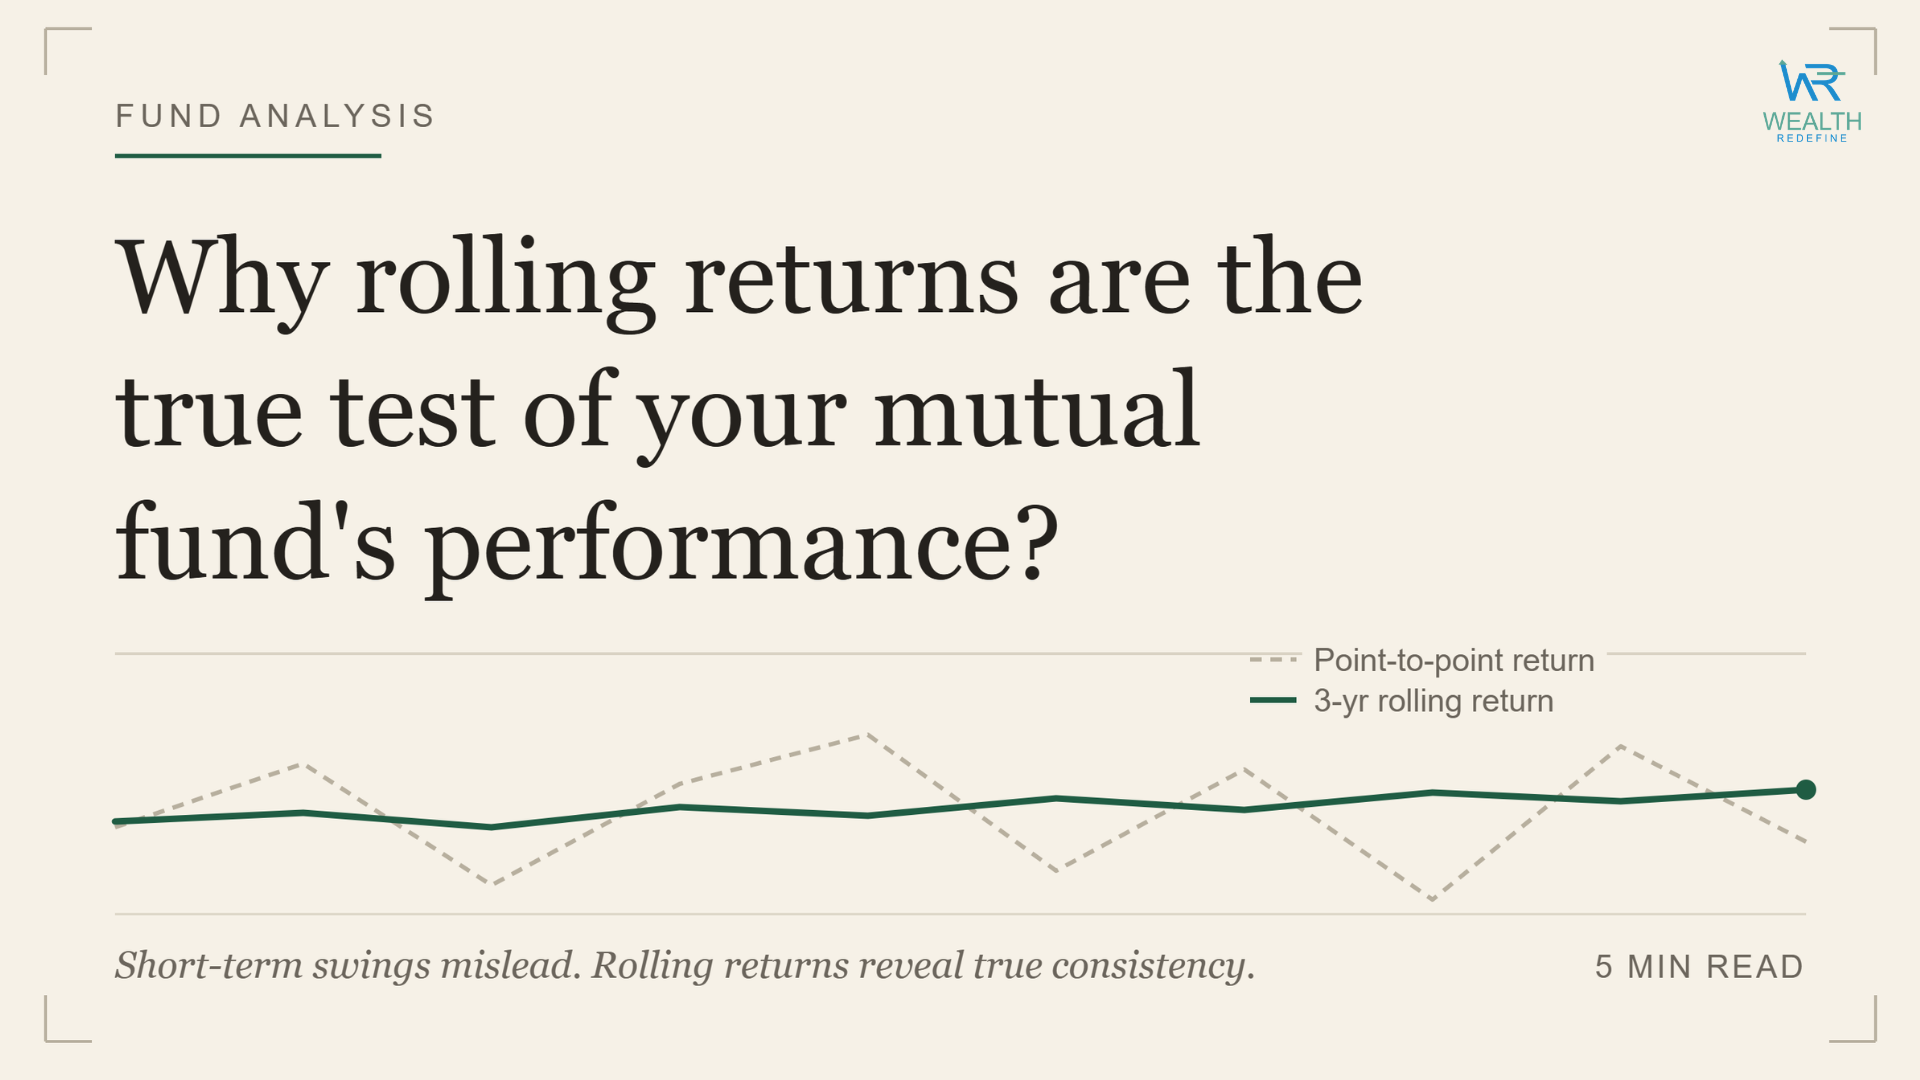
Have you ever picked a mutual fund based on its “5-year returns” shown on an app, only to wonder later why your actual experience felt so different?
You’re not alone. Most investors look at one number — usually a trailing return or CAGR — and assume that tells the full story. But it doesn’t. Because that single number only captures the performance between two specific dates. Change the dates slightly, and the picture can look completely different.
This is exactly where the rolling returns of mutual funds come in. They’re the most honest way to understand how a fund truly performs — not just on paper, but across different market conditions and entry points.
Let’s break it down in plain English.
What Are Rolling Returns in Mutual Funds?
Rolling returns are the average annualised returns of a mutual fund, calculated across multiple overlapping time periods — not just one fixed start and end date.
Think of it this way. If you want to understand how a fund performed over any 3-year window in the last decade, rolling returns give you hundreds of such 3-year return data points — one for every possible start date in that period. You then average them all out.
This is why AMFI and leading platforms like Value Research and CRISIL rely on rolling returns to measure fund consistency rather than just trailing numbers.
In simple words: instead of judging a fund by one snapshot, rolling returns give you the entire album.
How Rolling Returns Are Calculated
The calculation sounds complex but follows a straightforward logic.
Let’s say you want to calculate the 3-year rolling returns of a fund over a 5-year window (from January 2020 to January 2025). Here’s what you do:
- Pick the first period — calculate returns from January 1, 2020 to January 1, 2023.
- Roll forward by one day — calculate returns from January 2, 2020 to January 2, 2023.
- Keep rolling — repeat this for every single day until you reach the last possible 3-year window ending in January 2025.
- Average all the results — the final number you get is the average 3-year rolling return.
You end up with hundreds or even thousands of data points, depending on the window you choose. This is what makes it such a powerful tool.
For example, if a fund’s NAV was ₹16.26 on January 1, 2015 and ₹27.80 on January 1, 2020, the 5-year CAGR for that window works out to approximately 11.34%. But that’s just one period. Rolling returns would calculate dozens of such 5-year periods and give you a truer sense of what investors typically experienced.
What Are the Features of Rolling Returns?
Rolling returns have some distinct characteristics that make them stand out from other performance measures:
- They are time-neutral. Since you’re averaging returns across all possible entry dates, no single market event (like a crash or rally) skews the result unfairly.
- They reflect real investor experiences. Most investors don’t invest on the “perfect” date. Rolling returns mirror the reality of investing at different times.
- They show consistency. A fund that delivers steady rolling returns over 5 or 10 years is far more reliable than one that shines only occasionally.
- They can be measured daily, weekly, or monthly. Value Research, for instance, uses daily rolling returns to assess fund performance, which makes the analysis even more granular and accurate.
- They work across market cycles. Rolling returns cover bull phases, bear phases, sideways markets — all of it. This gives a much more complete picture than trailing returns ever can.
Why Do Investors Prefer Rolling Returns Over CAGR?
CAGR is useful — no question about that. It tells you how your investment grew on an annualised basis over a specific period. But here’s its biggest problem: it’s heavily influenced by the start and end dates you pick.
Suppose a fund peaked in late 2021. If you measure its 3-year CAGR ending then, it looks extraordinary. But measure the same fund’s 3-year CAGR ending in early 2020 — right after a crash — and it looks terrible. Same fund. Very different conclusions.
This is called point-to-point bias, and it makes CAGR misleading if you’re not careful.
Rolling returns fix this because they don’t rely on one convenient date. They capture every possible return scenario — giving you a far fairer and more complete view of what the fund has actually delivered.
Moreover, a 2024 analysis by Outlook Money highlighted how the annual return, 5-year trailing return, and 5-year rolling return of the same fund can differ significantly — proving that the metric you choose shapes the story you see.
Benefits of Using Rolling Returns to Evaluate Funds
There are several strong reasons why informed investors and fund analysts prefer rolling returns:
- Removes timing bias
Because rolling returns average out returns across all possible entry points, they don’t reward or penalise a fund just because of when you happened to measure it. - Shows real consistency
A fund that consistently beats its benchmark across rolling periods — not just once in a while — is a far more dependable choice. CRISIL’s research showed that the CRISIL-AMFI Equity Fund Performance Index never delivered negative returns over any 5-year rolling period since April 1, 1997, even though markets went through three bear phases in that time. - Helps compare funds fairly
When you compare two funds using rolling returns, you’re comparing apples to apples. One fund may have a higher trailing return just because it had a lucky exit point. Rolling returns cut through that. - Reveals hidden underperformers
Some funds look great on trailing returns but perform inconsistently when you examine their rolling data. Rolling returns expose funds that only perform well during certain market phases. - Aligns with how you actually invest
Most people invest through SIPs, which means they enter the market at different points over time. Rolling returns, therefore, more closely mirror the kind of return a SIP investor would have experienced.
What Are the Common Pitfalls and Limitations of Rolling Returns?
Although rolling returns are a powerful tool, they’re not without their limitations. Here’s what you should keep in mind:
- Past performance is still past performance
Rolling returns look backwards. They tell you how a fund has performed historically, but they can’t guarantee future results. Market conditions, fund manager changes, or shifts in investment strategy can all alter future performance. - They require more data and effort
Unlike trailing returns that are easily available on most apps, rolling returns require more data and calculation. However, platforms like Value Research, Advisorkhoj, and Prime Investor now offer rolling return calculators that make this easier. - The rolling period you pick matters
A 1-year rolling return tells a different story than a 5-year rolling return. If you pick too short a window, you might still fall prey to market noise. Ideally, for equity funds, a 3 to 5-year rolling period over a 10-year data set gives the most meaningful insights. - They don’t capture costs and taxes
Rolling returns typically reflect the fund’s NAV performance. They don’t always account for exit loads, expense ratios, or tax implications on redemption. Therefore, your actual net returns could be lower. - They can be misinterpreted without context.
A fund with a high average rolling return might still have wide variation in individual periods — meaning some investors had great outcomes while others did not. Always look at the consistency alongside the average.
Why Rolling Returns Are the True Test of Your Mutual Fund’s Performance
A fund’s true character shows up not in its best year, but in how it holds up across every kind of market — good, bad, and boring.
Rolling returns of mutual funds do exactly this. They don’t let a fund hide behind a fortunate start date or a well-timed rally. Instead, they measure performance across hundreds of overlapping periods, including the rough patches.
This is why serious investors and analysts trust rolling returns over any single number. It’s the only metric that accounts for every kind of investor — the one who started in a bull market, the one who began right before a crash, and everyone in between.
Moreover, a fund that scores well on rolling returns has genuinely earned its reputation — not just timed it.
Conclusion
Choosing a mutual fund based on its recent returns is a bit like judging a restaurant by the one meal you had there during a festival. It might have been exceptional — but was it consistent?
The rolling returns of mutual funds answer this question honestly. They show you how a fund performs not just on one lucky day, but across hundreds of different market scenarios. That’s why professional analysts, platforms like Value Research and Morningstar, and regulators like AMFI all place significant emphasis on rolling return analysis.
Next time you’re evaluating a fund, don’t stop at the 5-year CAGR. Ask: “What does the rolling return show?” That’s where you’ll find the real story.
And if you need help reading that story — we’re here.
Don’t Let Numbers Fool You — Let Us Help You Read Them Right
At Wealth Redefine, we help 2,000+ families manage over ₹600 crores — not by chasing the top-performing fund of the month, but by building portfolios that are consistent, tested, and right for your goals.
Rolling returns. Real insights. Right decisions.
Talk to us today, and let’s evaluate your current portfolio.
FAQs Related To Rolling Returns of Mutual Funds
Q1. What is the ideal rolling return period to evaluate an equity mutual fund?
For equity mutual funds, a 3-year or 5-year rolling period analysed over a 10-year window is generally considered the most reliable. This gives you enough data points to understand how the fund behaves across different market cycles.
Q2. Where can I check rolling returns of a mutual fund in India?
You can check rolling returns on platforms like Value Research, Advisorkhoj, Prime Investor, and Mirae Asset’s rolling return calculator. These tools allow you to compare a fund’s rolling returns against its benchmark over multiple periods.
Q3. Is a higher rolling return always better?
Not necessarily. A higher average rolling return is a good sign, but consistency matters equally. A fund with slightly lower but steady rolling returns is often more reliable than one with high averages but extreme variation between periods.
Q4. How is rolling return different from CAGR?
CAGR measures the return between two fixed dates. Rolling returns calculate the average of all possible returns within a larger period. Because of this, rolling returns are far less influenced by market timing and give a more balanced picture of fund performance.
Q5. Can rolling returns be negative?
Yes, they can — especially for shorter rolling periods in volatile categories like small-cap funds. However, CRISIL’s research shows that for well-diversified equity funds, 5-year rolling returns have historically been positive even during challenging market phases.
Q6. Should I replace CAGR with rolling returns entirely?
No. Both metrics serve different purposes. CAGR is good for understanding compounding and comparing absolute growth. Rolling returns are better for understanding consistency and reducing selection bias. Use them together for the most informed decision.









Great content! Keep up the good work!